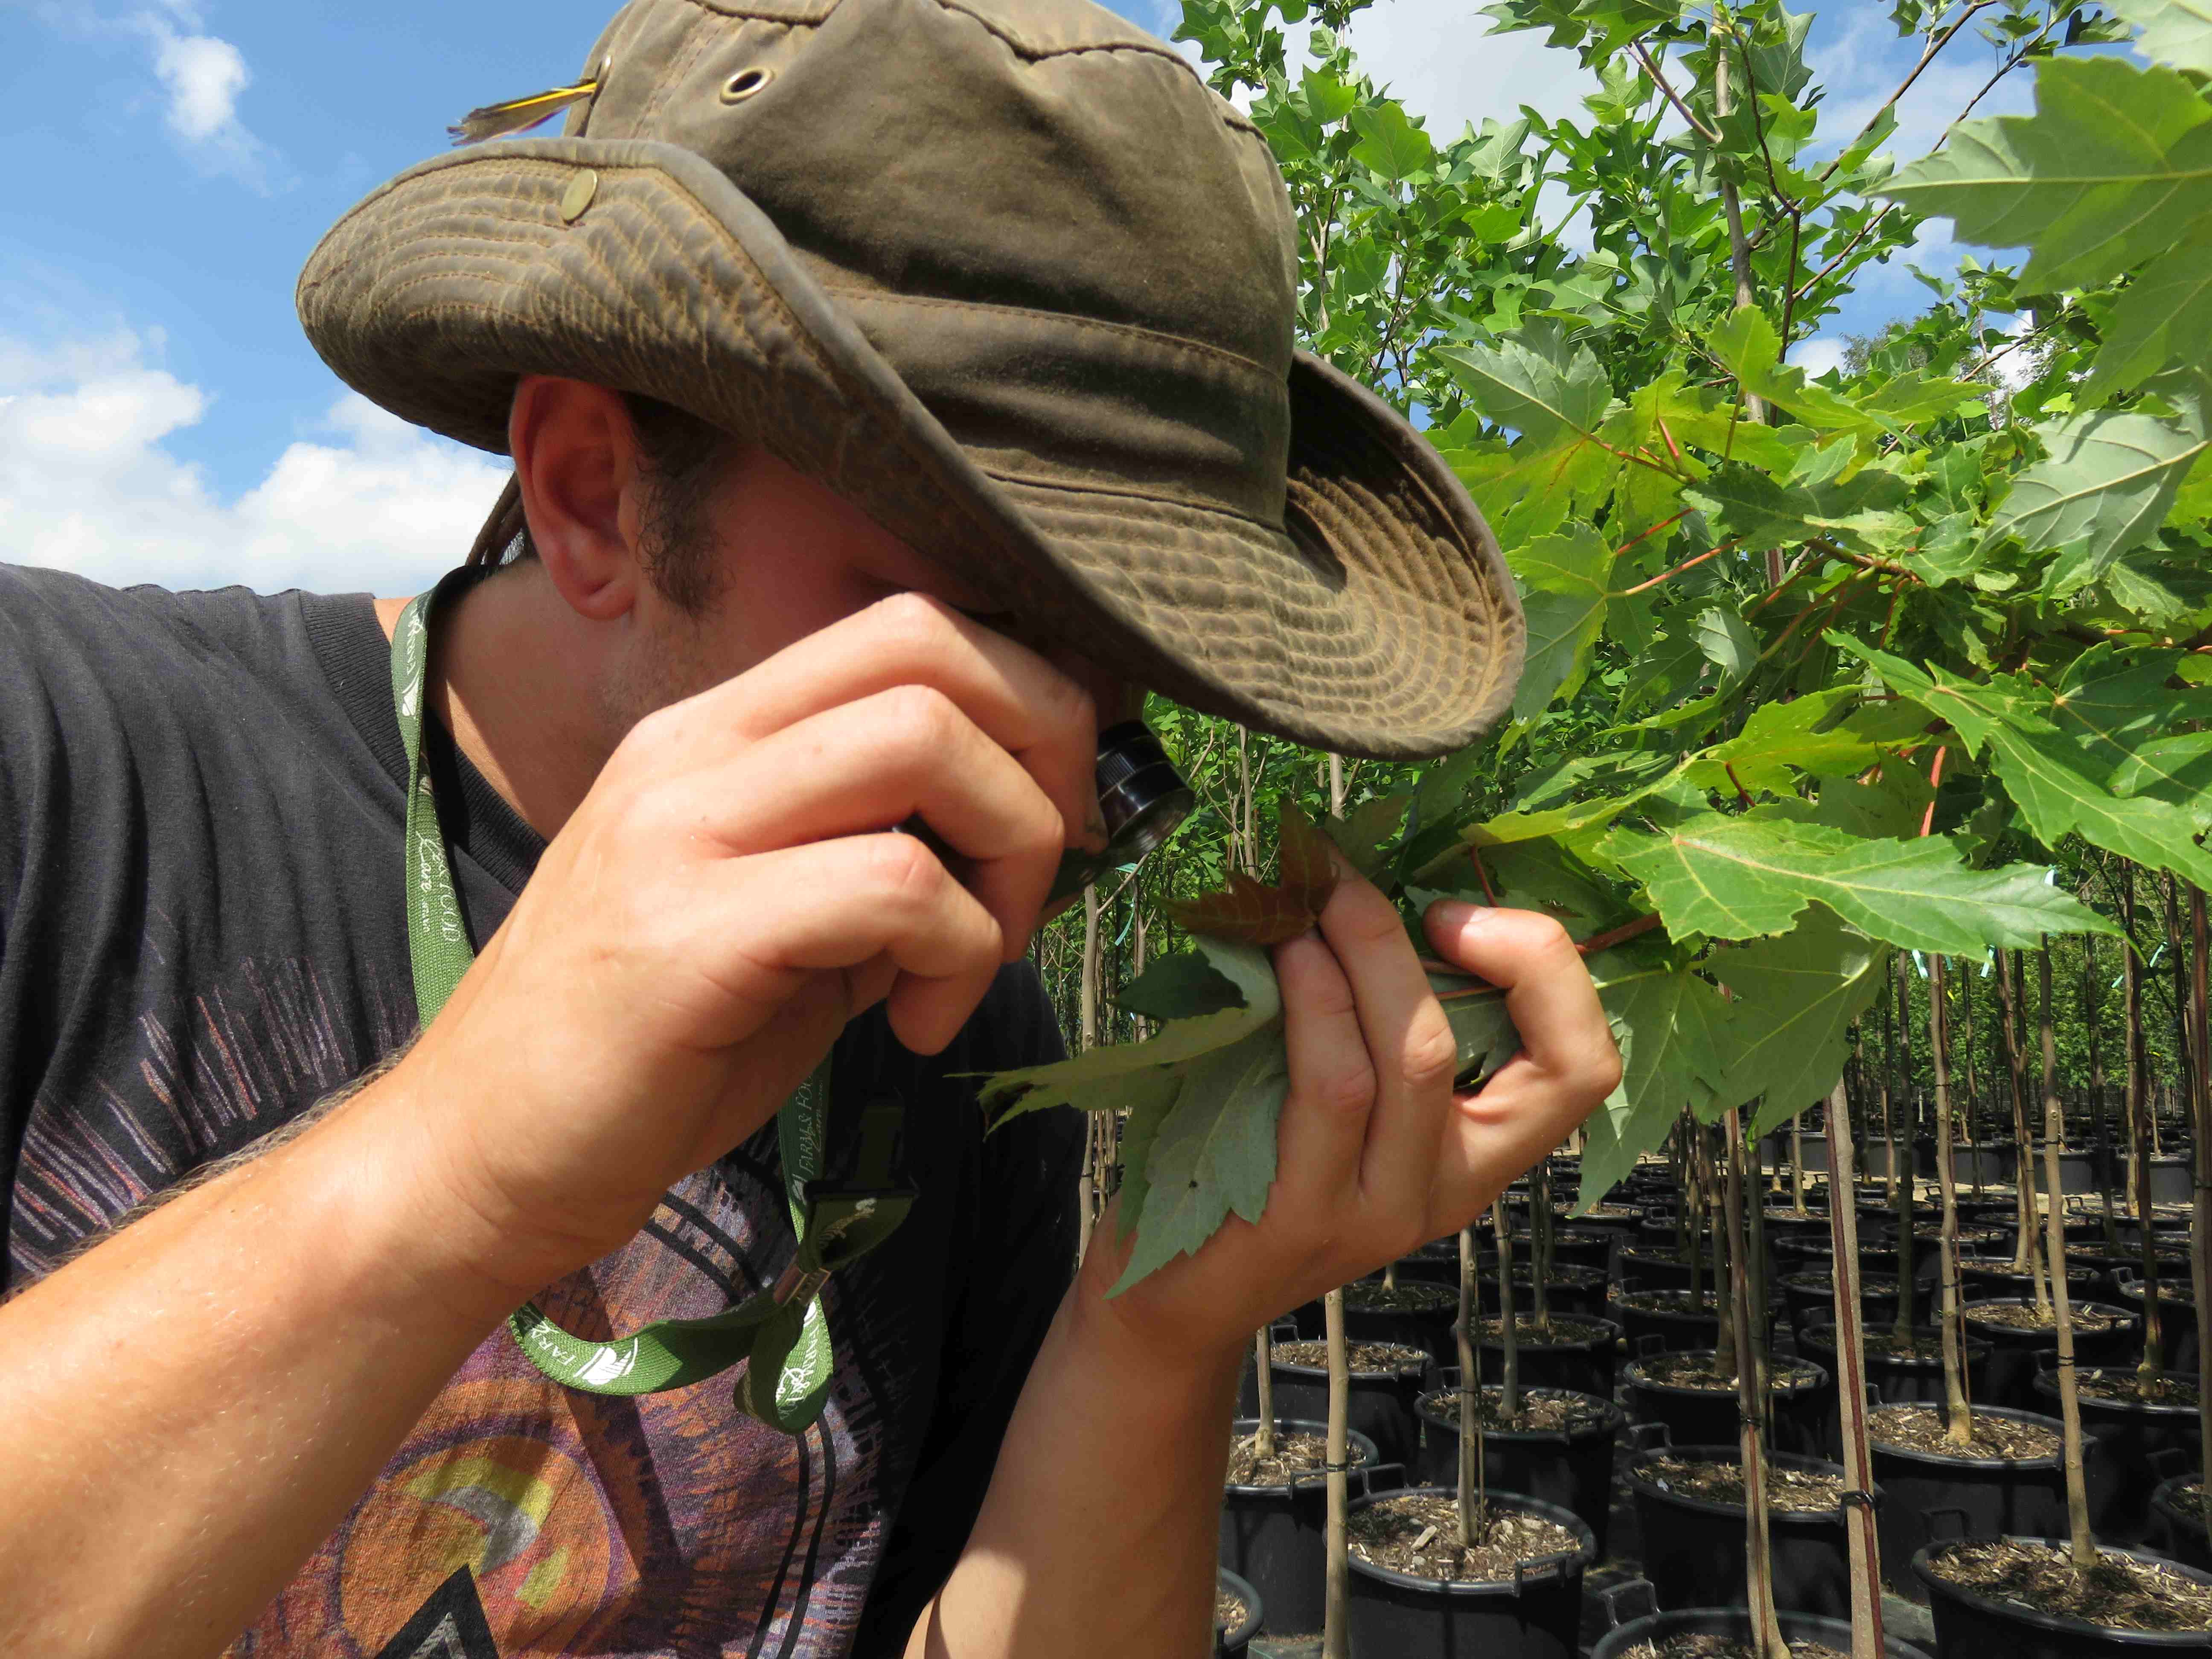
 Growers and landscapers use Growing Degree Day models to help predict when various developmental stages of pests will be present, based on temperature data they have collected themselves or obtained from the local weather office. These GDD pest models can be used to fine-tune the monitoring program and anticipate pests early. These models are meant to enhance the effectiveness of a monitoring program, not replace it. But unless you’re collecting temperature data from each monitoring site, it may not be accurate.
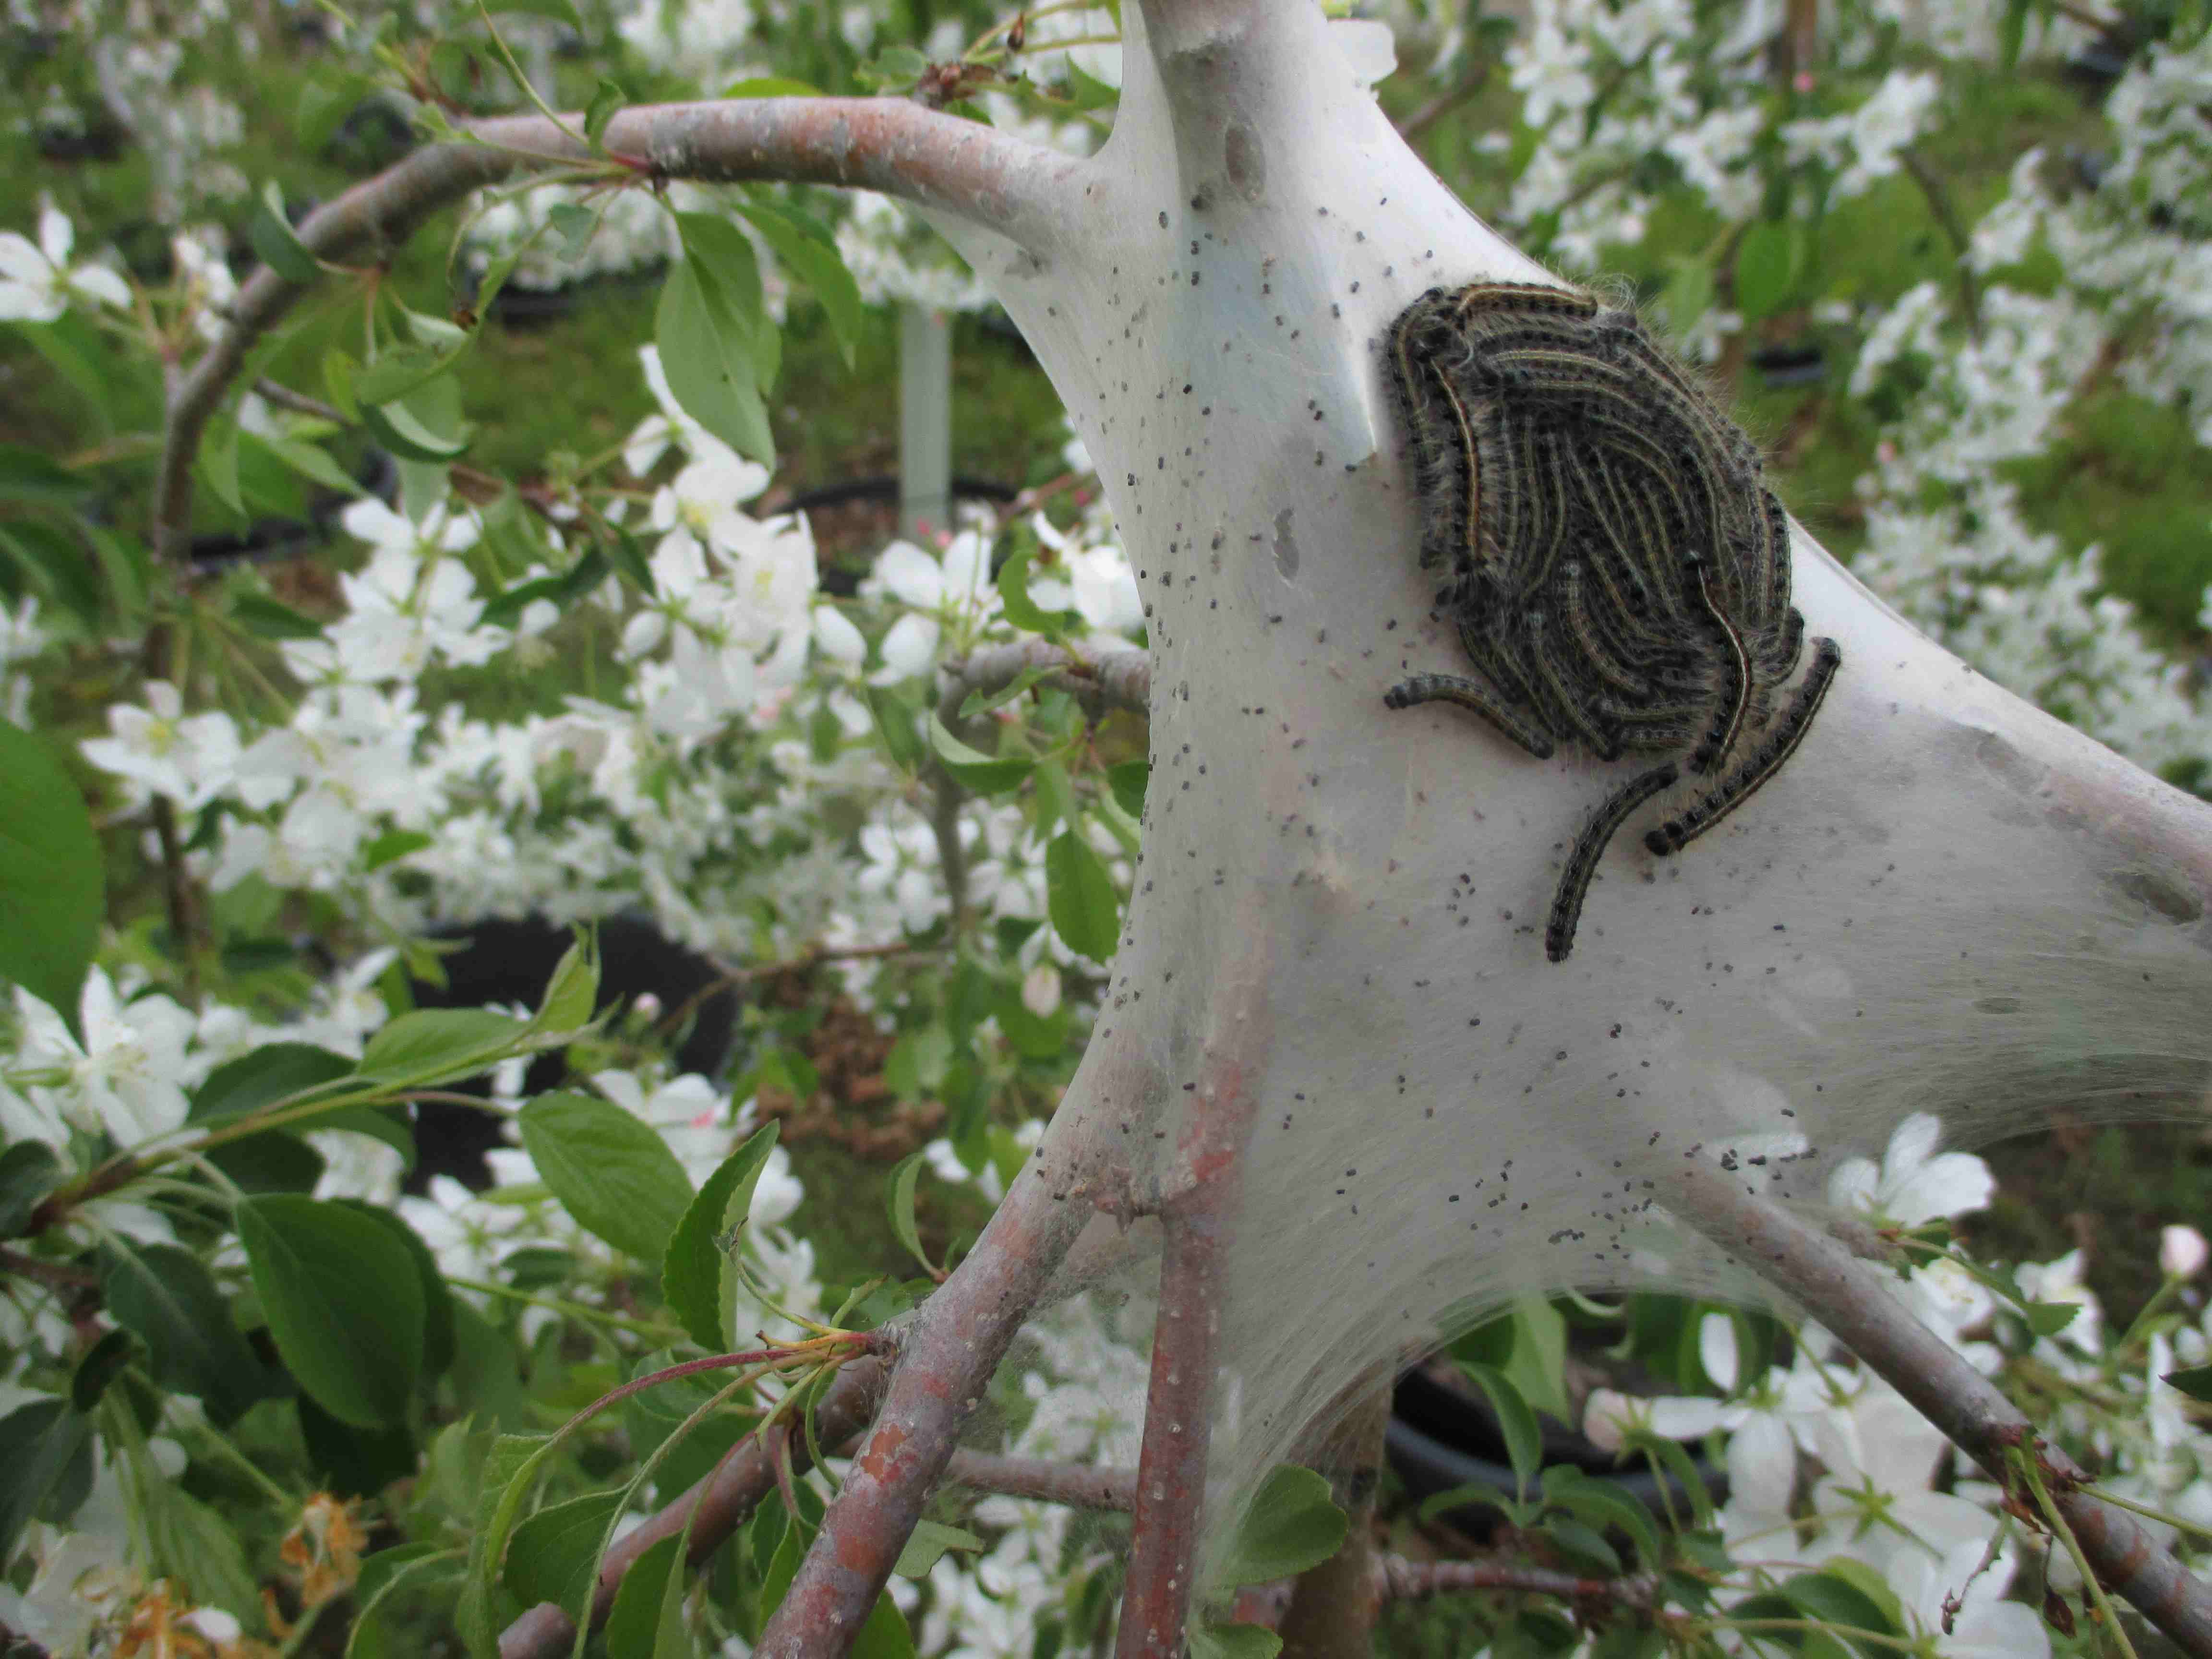 Plant pests have evolved with their plant hosts to synchronize their development with that of the host. It is very important for immature stages of insects to hatch at the same time that young, soft foliage is available for them to feed on. Imagine what would happen if the Eastern tent caterpillars hatched before the flowering crabapple leaves emerged? They wouldn’t survive and so there would be no genes to pass on to the next generation. Survival of the fittest, as Darwin would say.
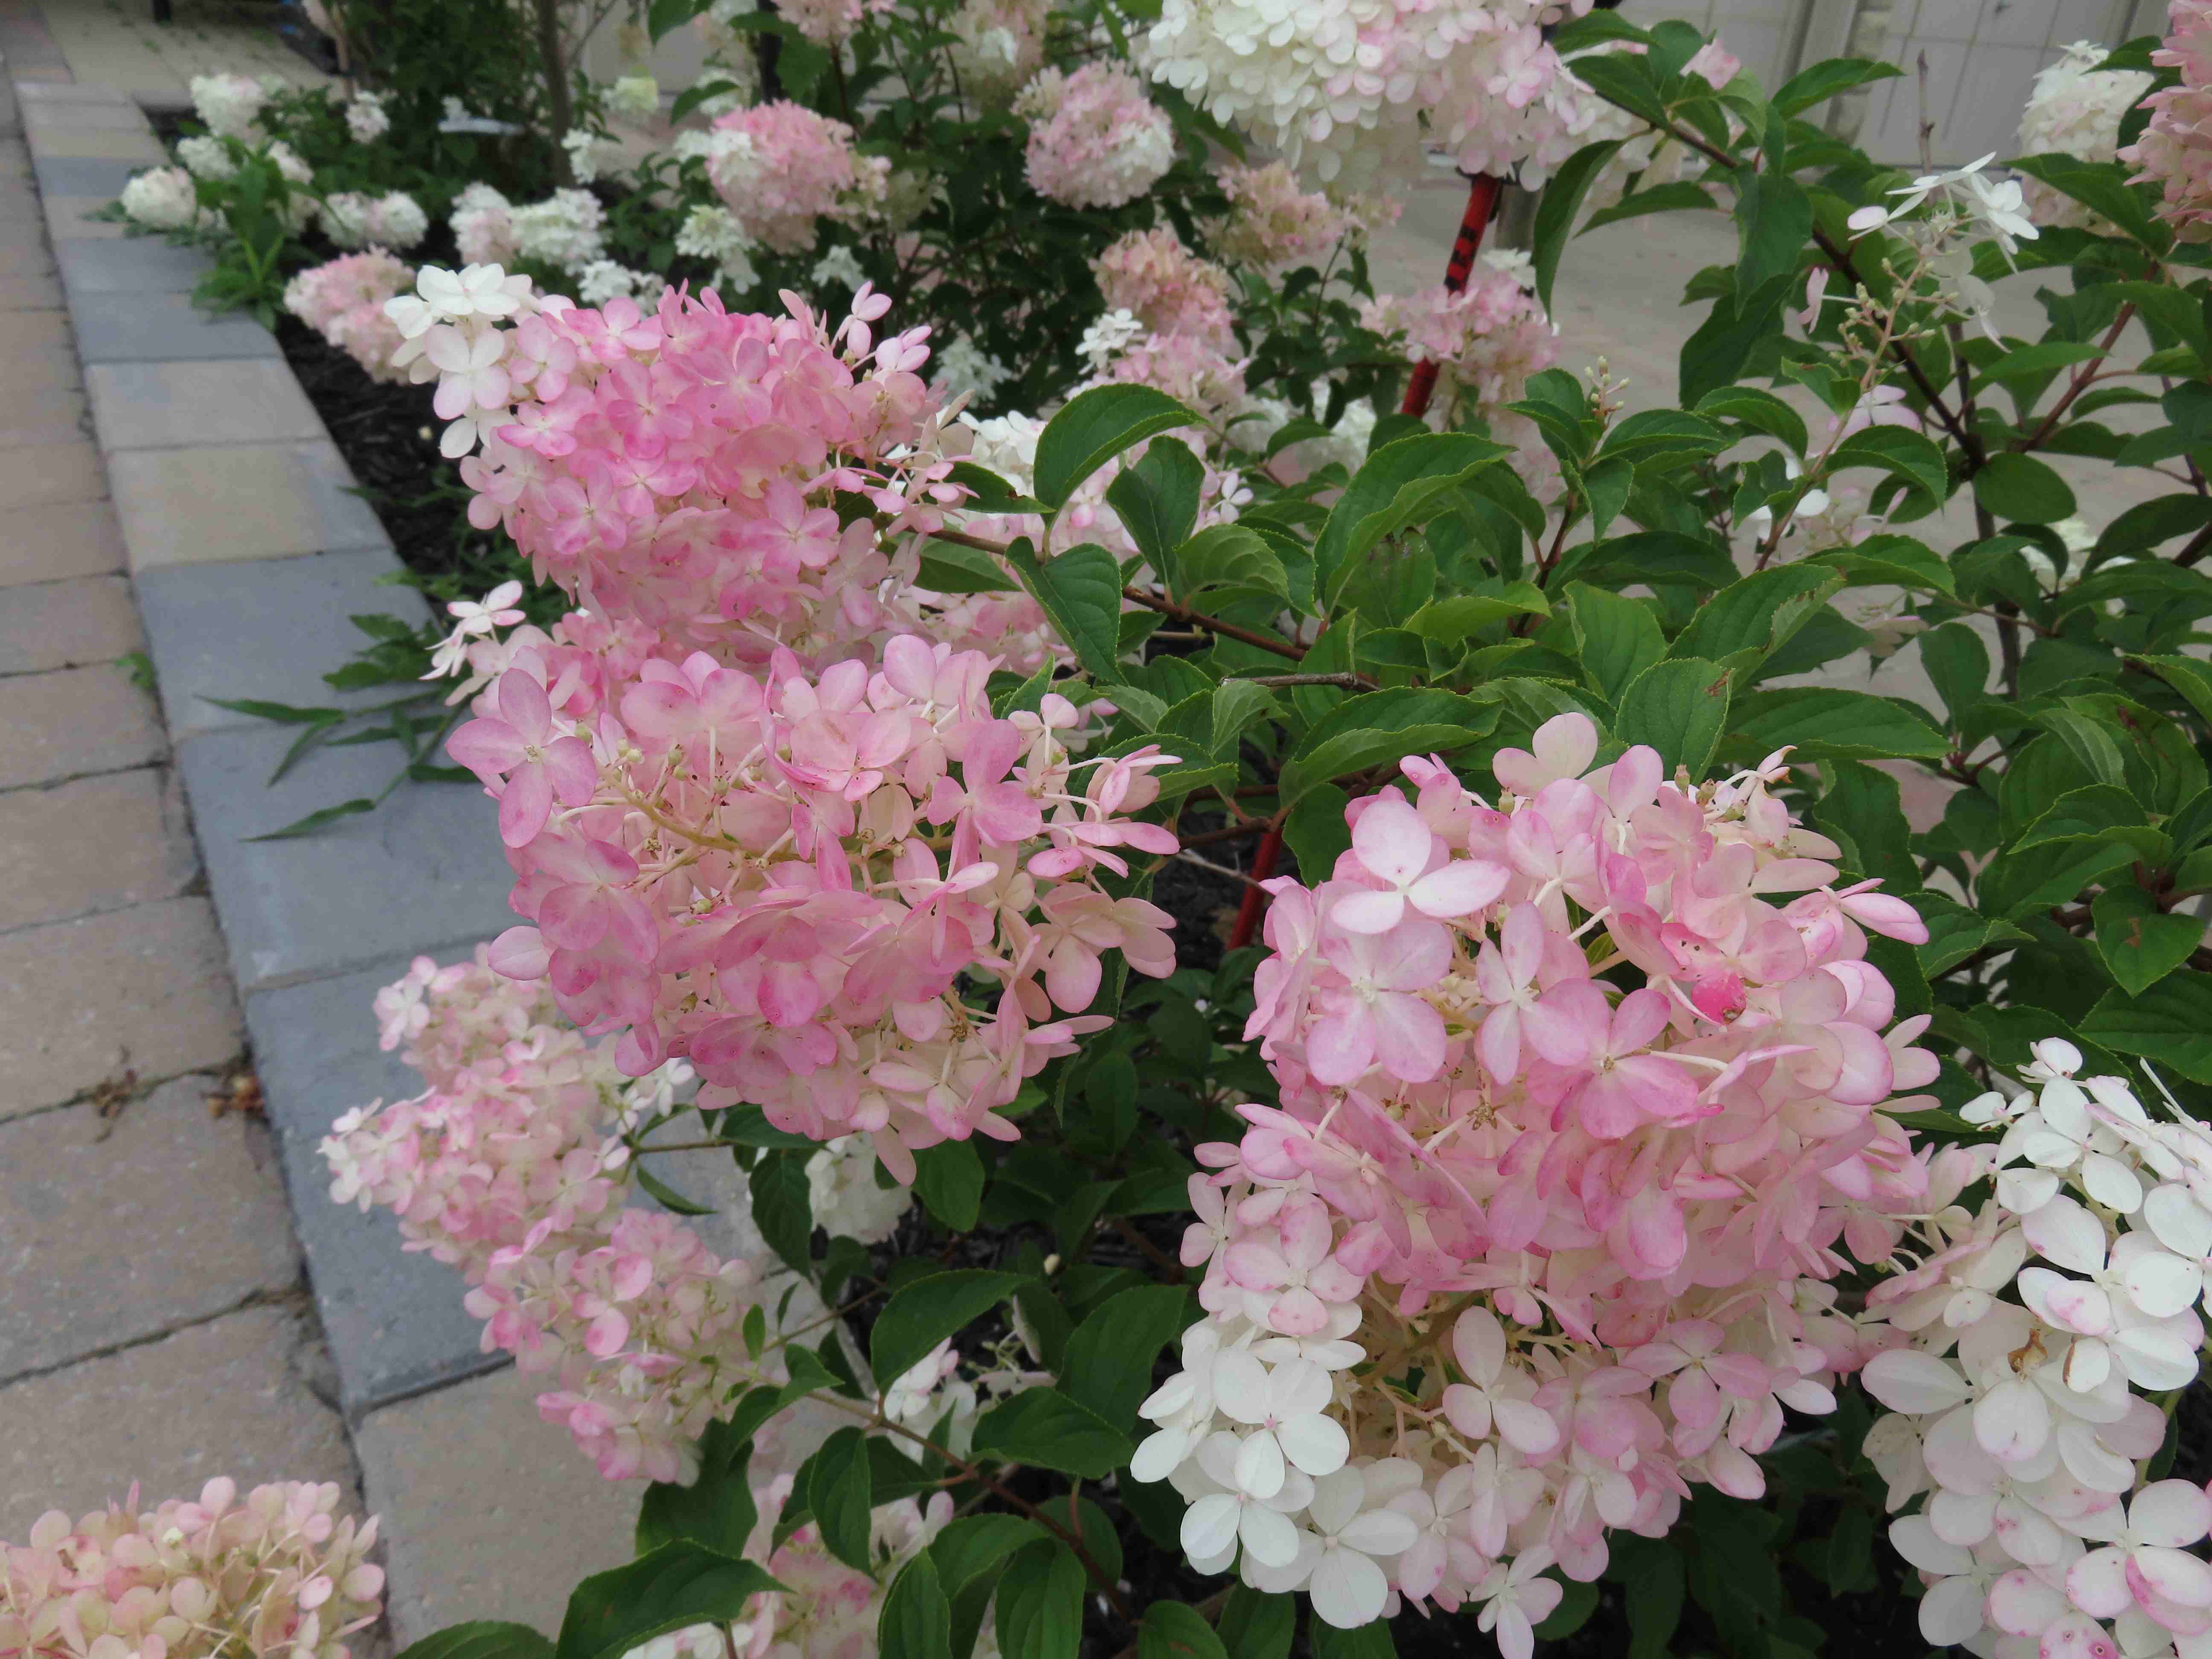
When the Hydrangea paniculata blossoms are turning from white to pink, larvacidal applications for peachtree borers and viburnum borers should be finishing up.
Over time, recorded temperature data for plants and plant pests have revealed that certain ornamental plants and insects pass through developmental stages at the same time. For example, when the Magnolia x soulangeana flowers are in the pink bud stage, the overwintering eggs of spruce spider mites are starting to hatch. By knowing when the most vulnerable pest life stages are happening, we then have the opportunity to monitor them and apply management techniques at the most effective time.
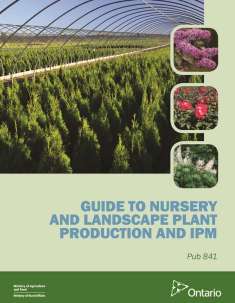
These indicator plants are referred to as “plant phenology indicators”. Some horticulturalists have found plant phenology indicators to be more accurate than GDD temperature models. There is a detailed list of common plant phenology indicators in OMAFRA publication 841, Guide to Nursery and Landscape Production & IPM (see Table 2–3, Common Phenology Plant Indicators for Ontario, on page 39). They can also be found in the table below.
 Donald Orton, a retired nursery inspector and part-time insect and plant disease instructor from Wheaton, IL is the author of the book: Coincide: The Orton System of Pest and Disease Management. Orton’s book is THE reference for ornamental plant pest phenology models and the main source of information for the models we use in Ontario.
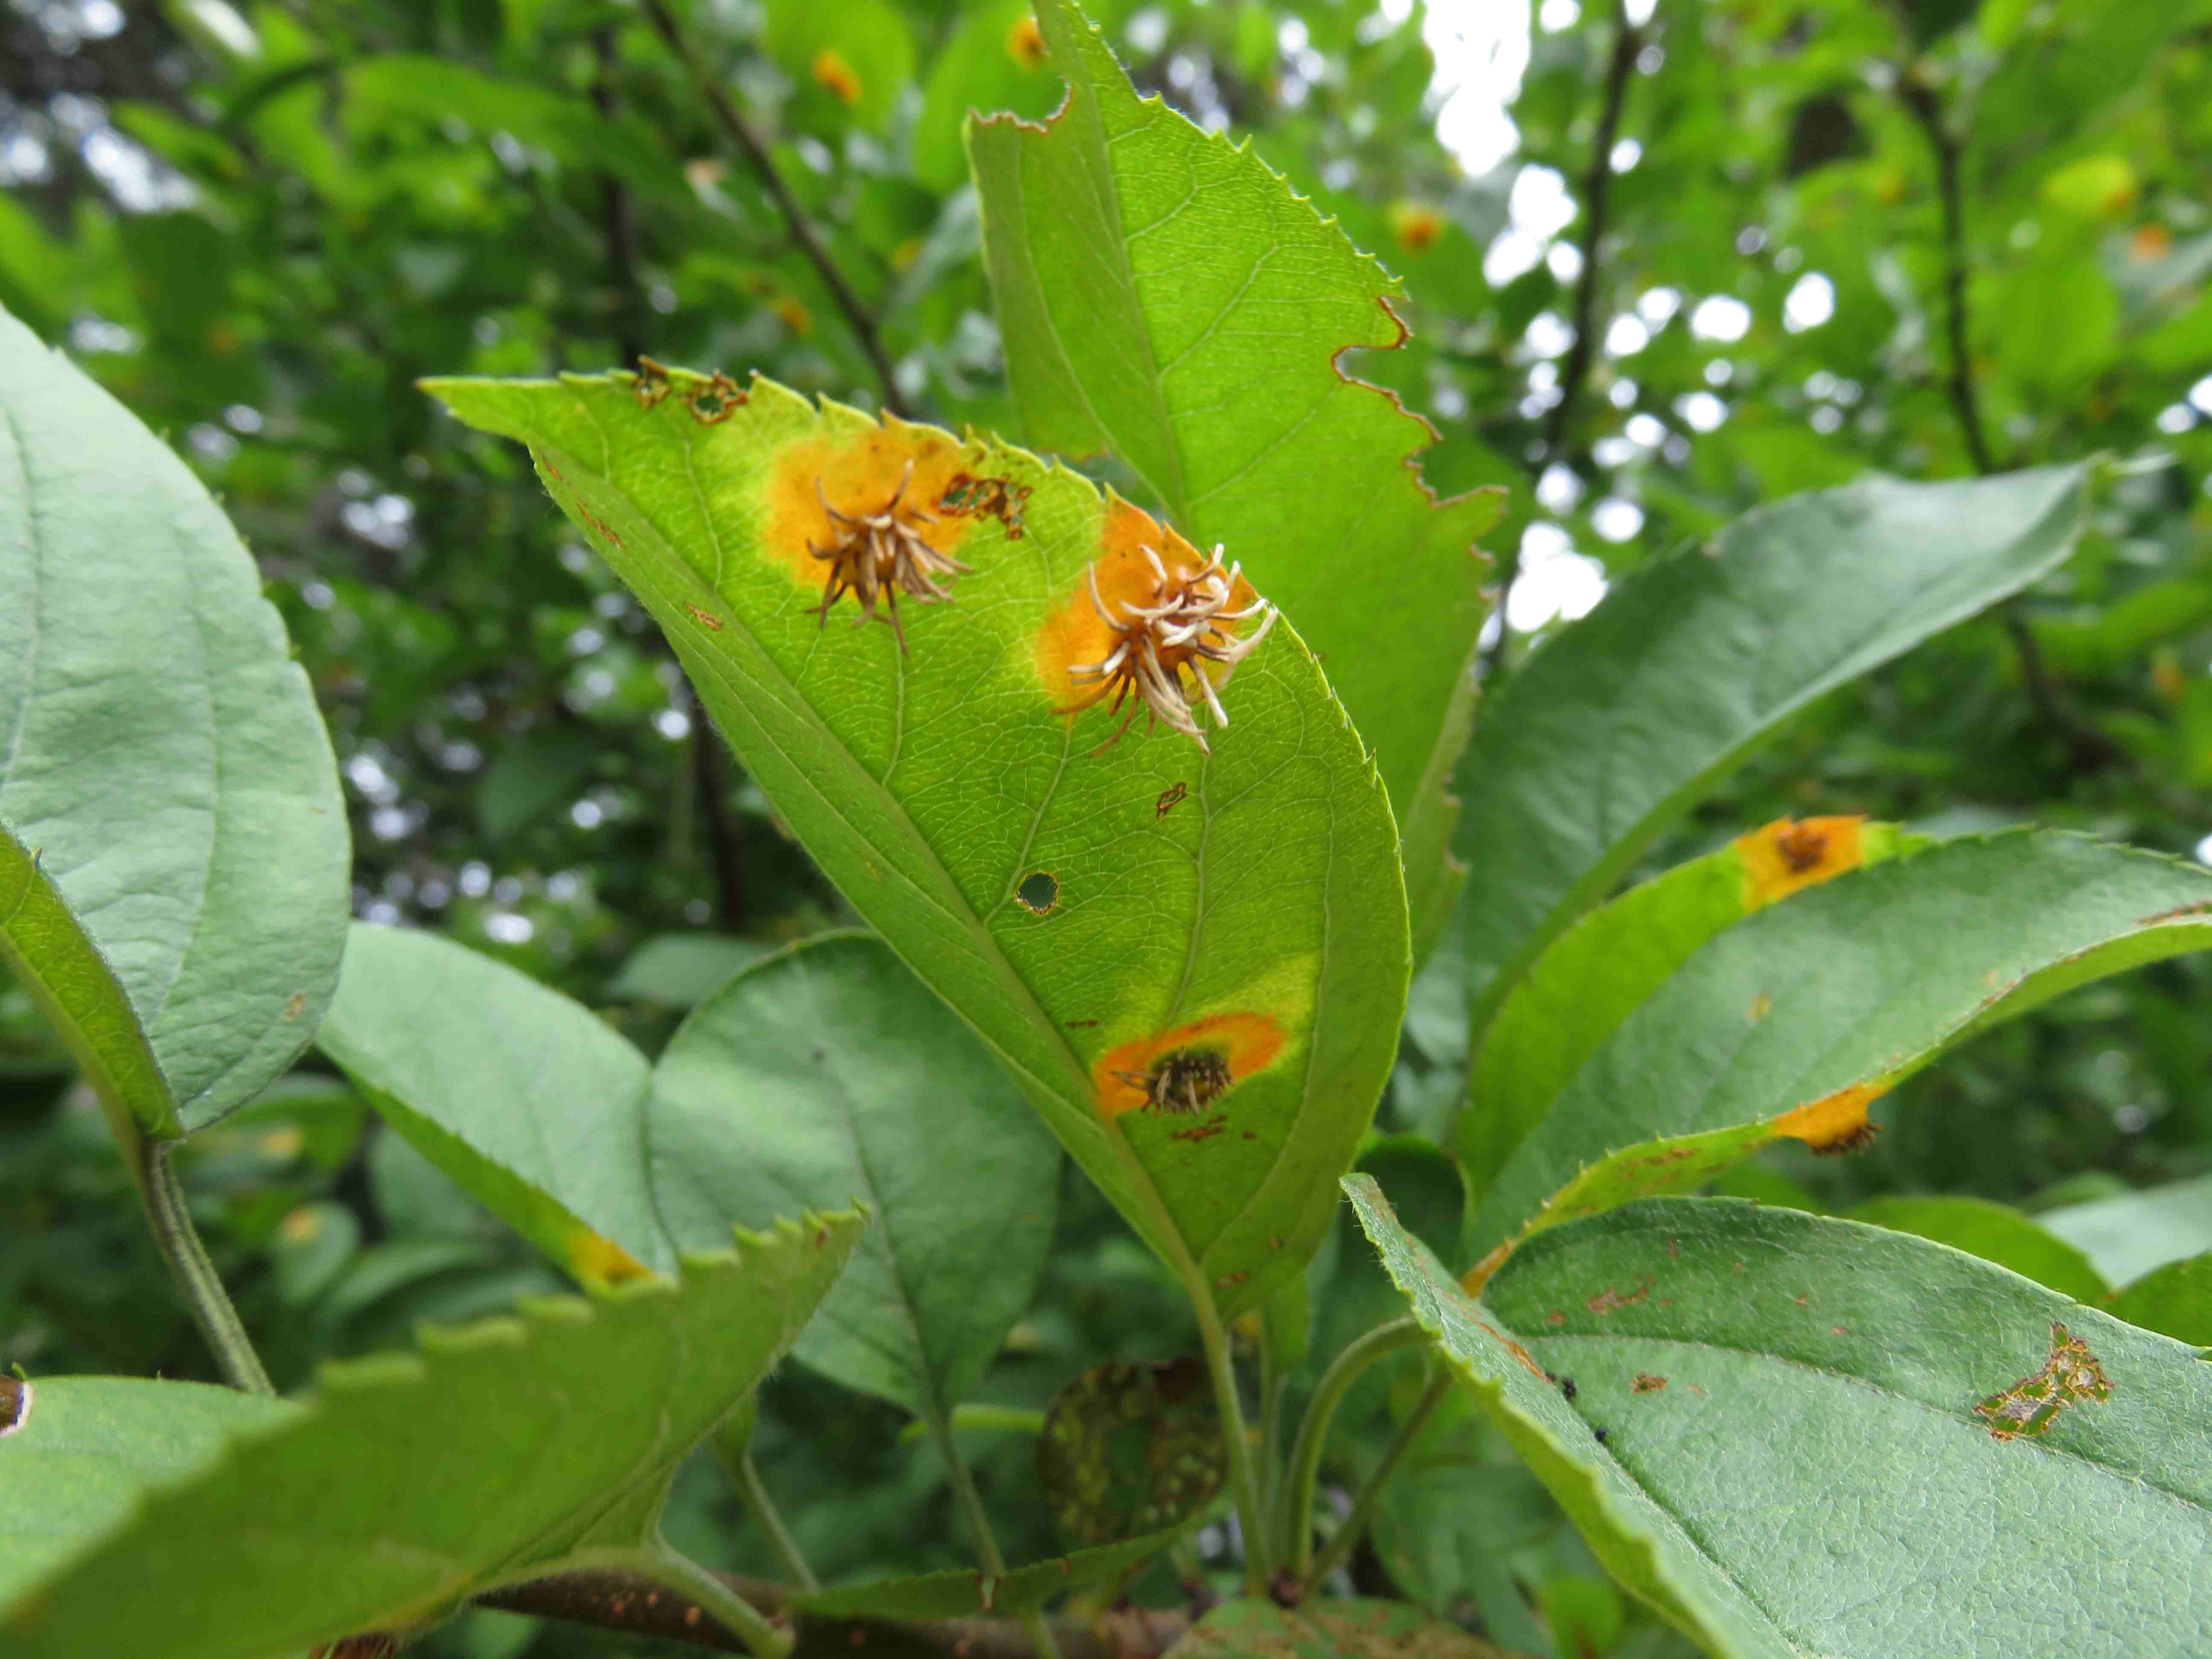
Cedar-apple rust (Gymnosporangium juniperi-virginiana) on crabapple leaves, late summer (J. Llewellyn)
So are there phenology models for plant diseases? Yes and no. Although plant diseases rely on temperature, they also rely on humidity and leaf wetness periods. So for instance, it was plenty warm enough in May, 2015 for the Gymnosporangium rusts diseases (e.g. cedar-apple rust, hawthorn rust) to sporulate, but it was really dry. Remember, it didn’t rain for nearly 3 weeks in May? That meant that overwintering galls on the Juniper hosts couldn’t sporulate until late May or even early June, until the rains came. By this time, that new soft first flush of foliage was hardening off and had developed a protective waxy cuticle to prevent a lot of those spores from infecting leaf tissue. There wasn’t a lot of Gymnosporangium rust in the landscape, not compared to the last several years. The trees I saw the summer stage of rust on were mainly those rosaceous plants in low-lying areas or crowded, shaded landscapes or those with overhead irrigation….where we would expect to find increased humidity and leaf wetness periods.
Plant development (heat accumulation) is affected by the plant’s proximity to large bodies of water, major changes in elevation (e.g. low lying areas) and in exposed versus protect sites (e.g. exposure to wind, sun). Of course plants growing in different hardiness zones and regions will differ in their development as well. In the spring and fall, there can be significant differences in heat units and therefore, plant development can vary quite a bit between these types of sites. Where plant health monitoring will be carried out in many locations (as in the case of landscape maintenance), reference plant phenology indicators at each location.
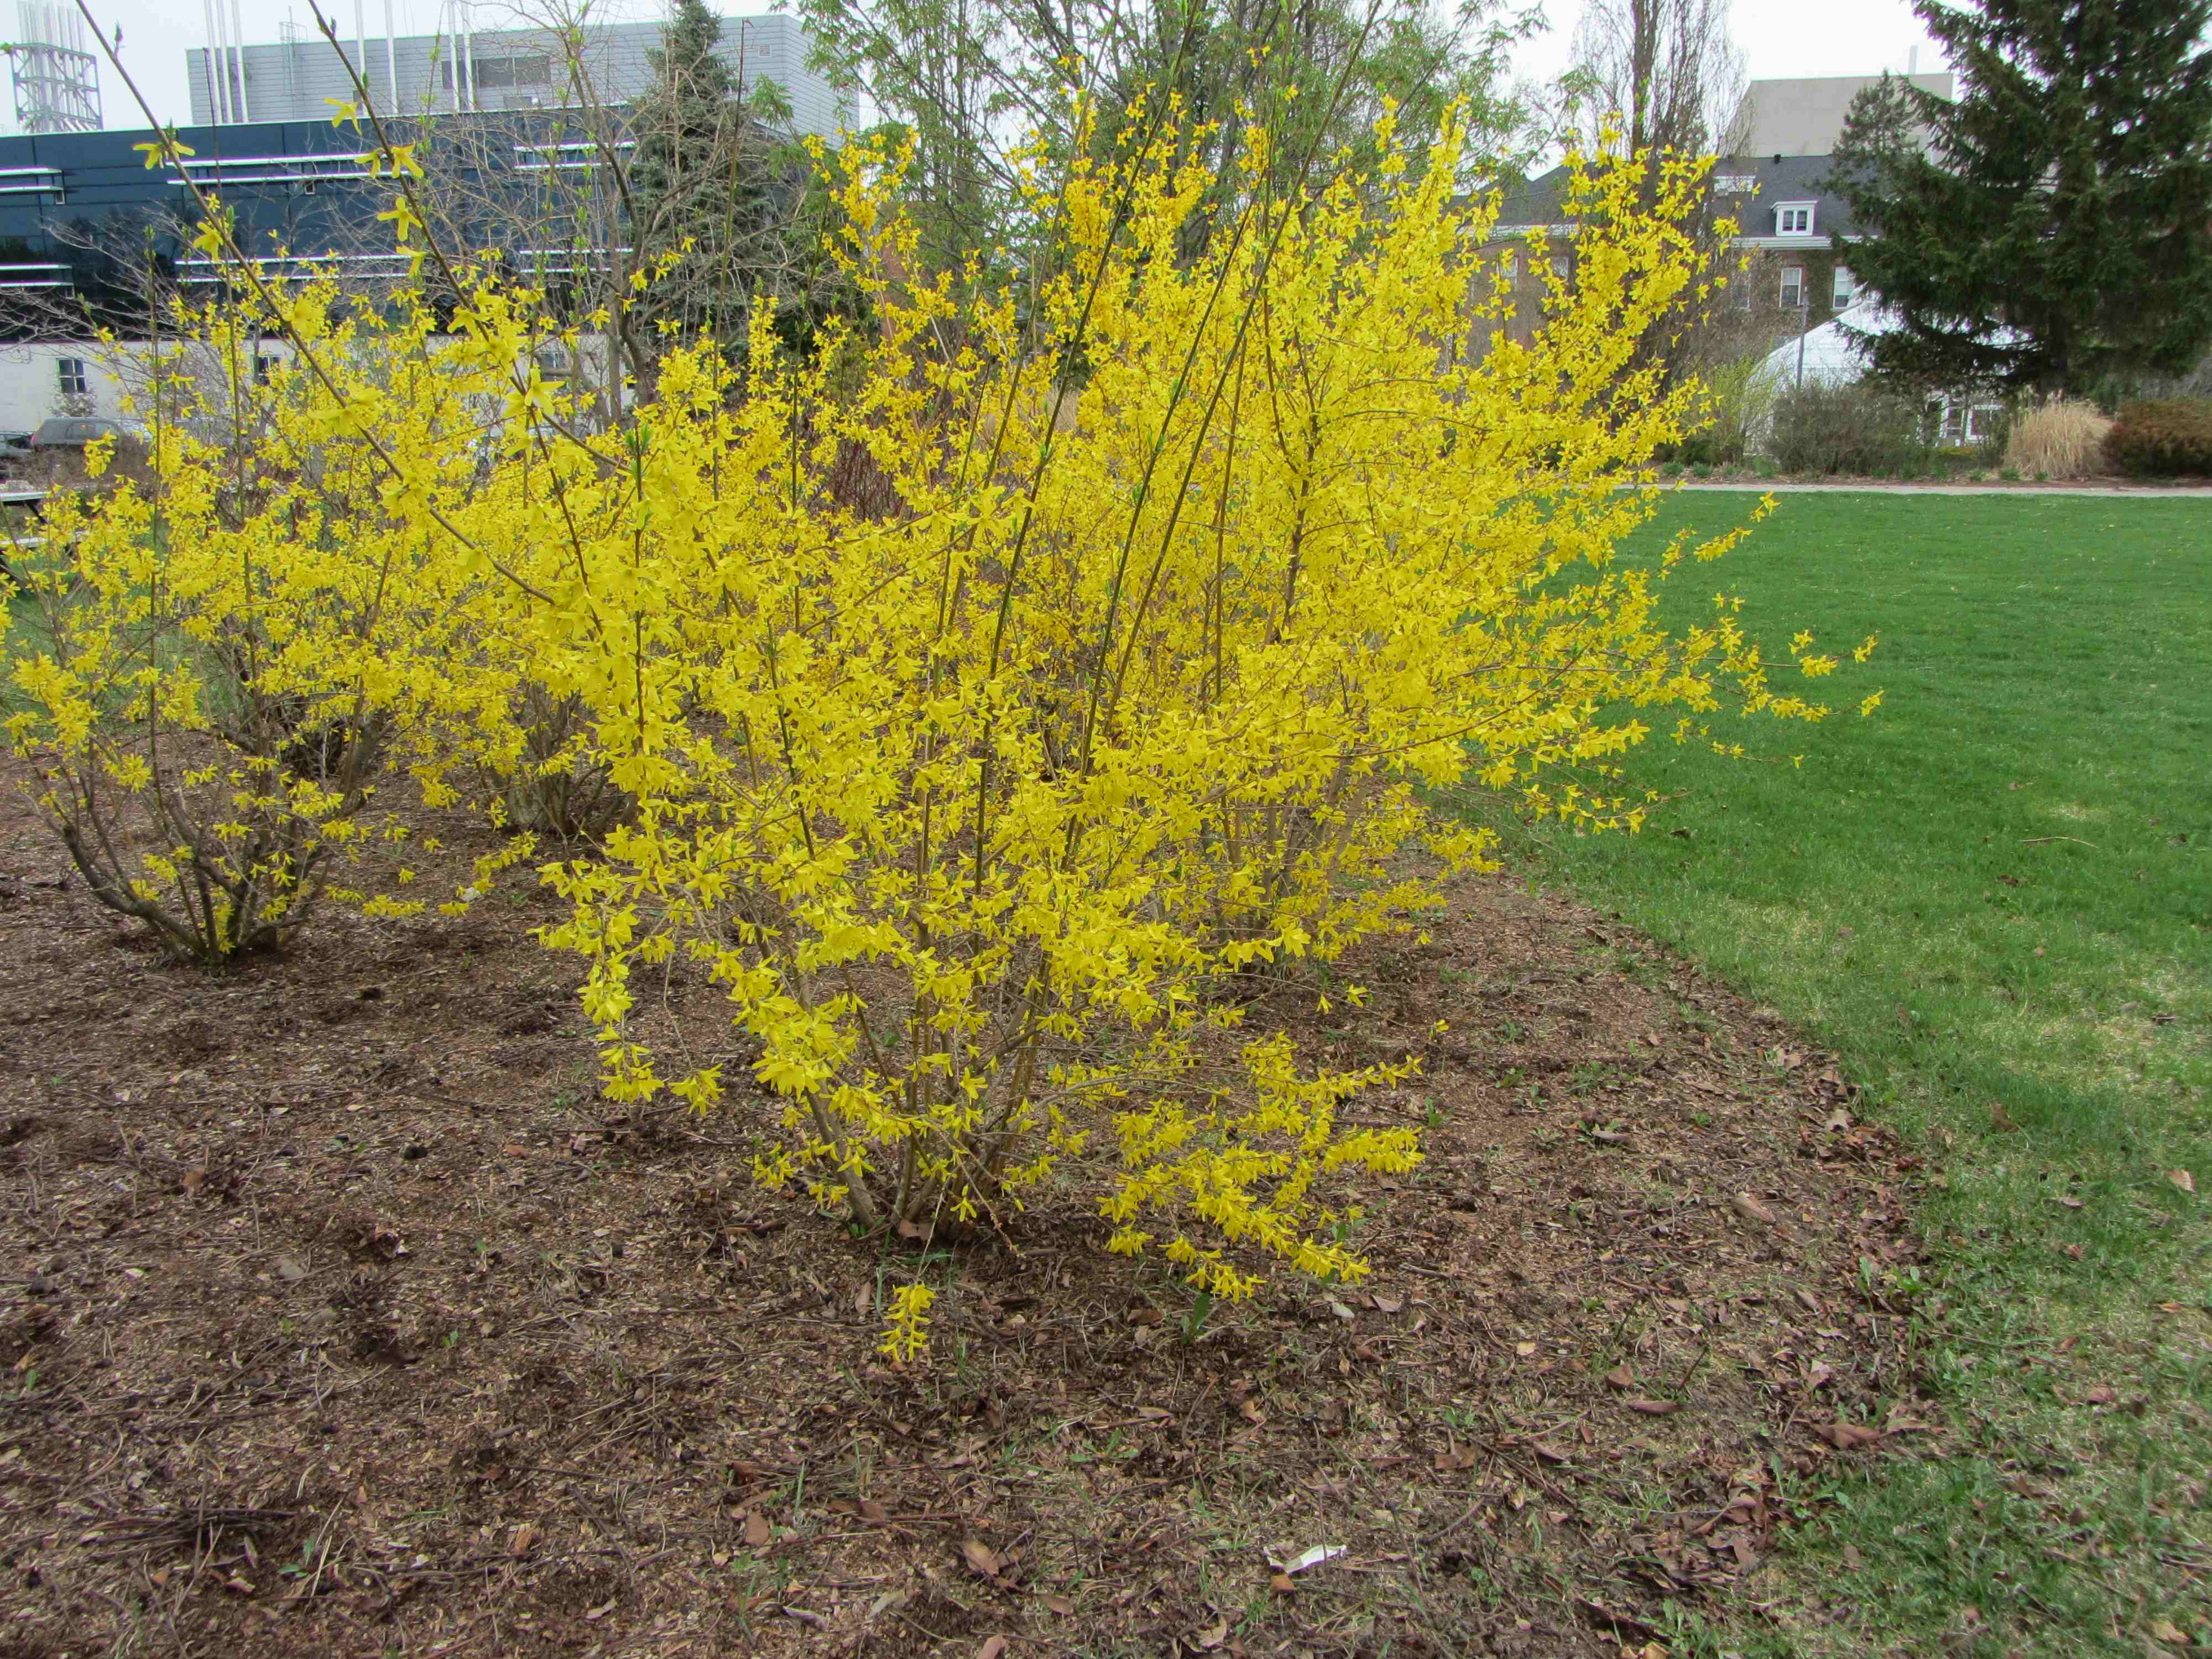
Where at least some of your monitoring activities take place in a defined area, it’s a really good idea to plant a Phenology Garden and fall is a great time of year to do it. Even a shrub phenology garden is a great source of phenology information.
TABLE 2–3. Common Phenology Plant Indicators for Ontario
| Acer platanoides | Norway maple |
| Acer rubrum | red maple |
| Acer saccharinum | silver maple |
| Acer saccharum | sugar maple |
| Aesculus hippocastanum | horsechestnut |
| Aesculus parviflora | bottlebrush buckeye |
| Amelanchier laevis | serviceberry, shadberry |
| Catalpa speciosa | northern catalpa |
| Cercis canadensis | redbud |
| Cirsium arvense | Canada thistle |
| Cornus alternifolia | pagoda dogwood |
| Cornus mas | cornelian cherry dogwood |
| Crataegus phaenopyrum | Washington hawthorn |
| Daucus carota | wild carrot (Queen Anne’s lace) |
| Forsythia sp. | forsythia |
| Gleditsia triacanthos | honeylocust |
| Hamamelis vernalis | spring-blooming witchhazel |
| Hamamelis virginiana | fall-blooming witchhazel |
| Hydrangea arborescens ‘Grandiflora’ | hills of snow hydrangea |
| Hydrangea paniculata ‘Grandiflora’ | panicle hydrangea |
| Kolkwitzia amabilis | beautybush |
| Lonicera korolkowii ‘Zabelii’ | zabel honeysuckle |
| Lonicera tatarica | tartarian honeysuckle |
| Magnolia x soulangeana | saucer magnolia |
| Philadelphus | mock orange |
| Pinus mugo | mugo pine |
| Prunus x cistena | purpleleaf sand cherry |
| Prunus serotina | wild black cherry |
| Prunus triloba | flowering almond |
| Ribes odoratum | golden or flowering currant |
| Robinia pseudoacacia | black locust |
| Salix caprea | pussy willow |
| Sambucus canadensis | American elder, elderberry |
| Solidago canadensis | Canada goldenrod |
| Sorbus aucuparia | European mountain ash |
| Spiraea nipponica ‘Snowmound’ | snowmound spiraea |
| Spiraea x vanhouttei | bridal wreath spiraea |
| Syringa reticulata | Japanese tree lilac |
| Syringa villosa | late lilac |
| Syringa vulgaris | common lilac |
| Ulmus pumila | Siberian elm |
| Viburnum carlesii | Koreanspice viburnum |
| Viburnum dentatum | arrowwood viburnum |
| Viburnum lantana | wayfaring tree viburnum |
| Viburnum opulus | European cranberrybush viburnum |
| Weigela florida | old-fashioned weigela |
| Yucca filamentosa | Adam’s needle |
The combined use of Growing Degree Day temperature data and Plant Phenology Indicators can give a clearer picture of the timing of pest emergence and other vulnerable life stages and results in greater success for management. To tailor your weekly IPM program, check out the Monitoring tables of timing and pest development stages for our ornamental trees and shrubs of OMAFRA’s publication 841, Guide to Nursery and Landscape Production & IPM (Tables 2–4 to 2–17, starting on page 41).